Research/Theme 02

Synaptic imaging

We use imaging of synaptic vesicle glycoprotein 2A (SV2A), including PET with [11C]UCB-J, to investigate changes associated with disease and treatment.

SV2A[11C]UCB-J PET[3H]UCB-J autoradiographyRats · minipigs
Schematic Schematic of a nerve terminal A nerve terminal is filled with small synaptic vesicles. SV2A sits in the membrane of each vesicle. Tracer molecules of [11C]UCB-J bind to some of the SV2A. Below the terminal, across a narrow gap, is the next neuron. NEXT NEURON [11C]UCB-JBINDS SV2A SYNAPTICVESICLE SV2AON VESICLES NERVE TERMINAL

At a glance

Main biological question
How do disease and treatments affect synaptic biology? We measure SV2A binding, a proxy for synaptic density, not a count of synapses.
What we are investigating now
Using UCB-J PET and autoradiography to investigate changes in SV2A binding in disease models and after therapeutic interventions, supported by complementary tissue analyses.
Approaches and models
[11C]UCB-J PET with kinetic modelling; [3H]UCB-J autoradiography on the BeaQuant; blocking with levetiracetam to check specificity; tissue analyses. Rats, Göttingen minipigs and post-mortem human tissue.
Established in published work
SV2A binding was higher one hour after a single dose of S-ketamine in Wistar Kyoto rats, a model of depression (Bærentzen et al. 2024). After a 6-OHDA lesion, exercised rats did not show the loss of striatal SV2A binding seen in sedentary rats (Binda et al. 2021). Binding was lower after ear vagus nerve stimulation in rats (Binda et al. 2025) and after daily sucrose in minipigs (Bærentzen et al. 2024), and unchanged in Alzheimer's frontal cortex (Metaxas et al. 2019). Supporting these measurements, PET and autoradiography found closely matching losses of SV2A binding in lesioned rats (Thomsen et al. 2021); in minipigs, agreement depended mainly on grey–white matter contrast, so it is tested region by region (Thomsen et al. 2020).
Useful collaborations
Groups with models or tissue where synaptic change is a question; studies that need PET findings checked against tissue; SV2A autoradiography on sections. How to start a project →

01 What we found

What SV2A imaging has shown in our published studies

SV2A binding went down in some conditions, up in others, and sometimes did not change even when other markers did. Each finding below is from a published paper; the direction refers to SV2A binding, not to a count of synapses.

Disease models and treatments: examples

  1. ↑

    S-ketamine. In Wistar Kyoto rats, a model of depression, one subanaesthetic dose of the rapid-acting antidepressant raised [3H]UCB-J binding in the nucleus accumbens and in dorsal and ventral hippocampus one hour later. The effect was absent in control Wistar Hannover rats.

    AutoradiographyRatBærentzen et al., Neurosci Appl 2024 · doi

  2. ↑

    Exercise after a 6-OHDA lesion. Sedentary lesioned rats lost [3H]UCB-J binding in the striatum and substantia nigra on the injected side. Lesioned rats that ran on a treadmill for five weeks had higher striatal binding than sedentary ones, and higher binding in thalamus and hippocampus.

    AutoradiographyRatBinda et al., Exp Neurol 2021 · doi

  3. ↓

    Vagus nerve stimulation through the ear. In healthy rats, 30 minutes of transcutaneous auricular vagus nerve stimulation lowered [11C]UCB-J binding by 36–59% in frontal cortex, striatum and midbrain, more than sham stimulation did. [18F]FDG PET in other rats, with the tracer injected before stimulation, showed no detectable change in uptake under the protocol tested. More in Theme 03 →

    PETRatBinda et al., Psychophysiology 2025 · doi

  4. ↓

    Daily sucrose. After 12 days of drinking sucrose solution, Göttingen minipigs had lower [3H]UCB-J binding in prefrontal cortex than controls.

    AutoradiographyMinipigBærentzen et al., Neuropharmacology 2024 · doi

More findingsShow less: What SV2A imaging has shown in our published studies

Disease models

  1. ↓

    Striatal lesions. In rats, [11C]UCB-J PET showed lower striatal binding on the lesioned side: a small 6.2% decrease after 6-OHDA, a Parkinson's model, and 39.3% and 55.1% after two doses of quinolinic acid, a Huntington's model. Autoradiography confirmed the quinolinic acid losses.

    PET + autoradiographyRatThomsen et al., JCBFM 2021 · doi

  2. ↓

    α-Synuclein fibrils. After fibrils were injected into one striatum, PET showed a progressive loss of VMAT2 binding ([11C]DTBZ), a marker of dopamine terminals, accompanied by a small, progressive decrease in [11C]UCB-J binding in the same area.

    PETRatThomsen et al., Neurobiol Dis 2021 · doi

  3. =

    α-Synuclein overexpression. Dopamine content fell on the injected side, yet [3H]UCB-J binding was unchanged: losing dopamine terminals alone was not enough to lower overall SV2A binding in the striatum.

    AutoradiographyRatStokholm et al., Biomedicines 2021 · doi

  4. =

    Alzheimer's disease, post-mortem tissue. In frontal cortex, [3H]UCB-J binding did not differ between patients and non-demented subjects, while TSPO binding, used as a marker of neuroinflammation, was higher. In patients, more tau pathology went with lower [3H]UCB-J binding.

    AutoradiographyHuman tissueMetaxas et al., Front Cell Neurosci 2019 · doi

  5. =

    Chronic mild stress. In a rat model of depression, SV2A binding in prefrontal cortex and hippocampus was unchanged across all groups and both times of day, while mGluR5 binding changed.

    AutoradiographyRatKnudsen et al., Prog Neuropsychopharmacol Biol Psychiatry 2025 · doi

Treatments and drugs

  1. ↑

    A single dose of cocaine. In adolescent rats, [3H]UCB-J binding in dorsal and ventral hippocampus was higher seven days after one dose, but not after one hour.

    AutoradiographyRatRossi et al., Acta Neuropsychiatr 2024 · doi

Lifestyle factors

  1. ↓

    Fatty liver disease. Rats fed a high-fat, high-cholesterol diet developed fatty liver disease. [3H]UCB-J binding in prefrontal cortex fell to 92% of control, alongside higher TSPO binding and microglial changes on Iba1 staining. More in Theme 04 →

    AutoradiographyRatKjærgaard et al., JHEP Rep 2024 · doi

Four coronal rat brain autoradiograms of [3H]UCB-J binding at striatal level, arranged saline versus 6-OHDA and sedentary versus exercised, with dashed circles over the left and right striatum.
Exercise and SV2A binding after a 6-OHDA lesion. [3H]UCB-J autoradiograms at the level of the striatum in saline- and 6-OHDA-injected rats, sedentary or exercised; dashed circles mark the striatum. Warmer colours mean more binding (relative scale). Binda KH, Lillethorup TP, Real CC, Bærentzen SL, Nielsen MN, Orlowski D, Brooks DJ, Chacur M, Landau AM. Exp Neurol 2021;342:113741 · Figure 4A · doi:10.1016/j.expneurol.2021.113741 · CC BY 4.0, cropped.

02 The question

Can we follow synapses in the living brain?

Read moreShow less: Can we follow synapses in the living brain?

Synapses are the contact points where nerve cells pass signals to one another. Losing or remodelling them is part of many brain disorders, and some treatments may act by changing them.

Synapses are far too small to see with PET. Instead, we image a protein found in them: synaptic vesicle glycoprotein 2A (SV2A). SV2A sits in the membrane of the small vesicles that store neurotransmitter, and it is present in nerve terminals throughout the brain, whatever neurotransmitter they carry.

[11C]UCB-J is a PET tracer that binds SV2A. It belongs to a family of tracers developed from levetiracetam, an anti-seizure drug that binds the same protein.

By combining imaging with analyses of brain tissue, we examine how changes in SV2A binding relate to synaptic biology and synaptic density.
SV2A binding is a proxy for synaptic density, not a count of synapses.The same drop in binding could have more than one cause. That is why we check PET against measurements in brain tissue.

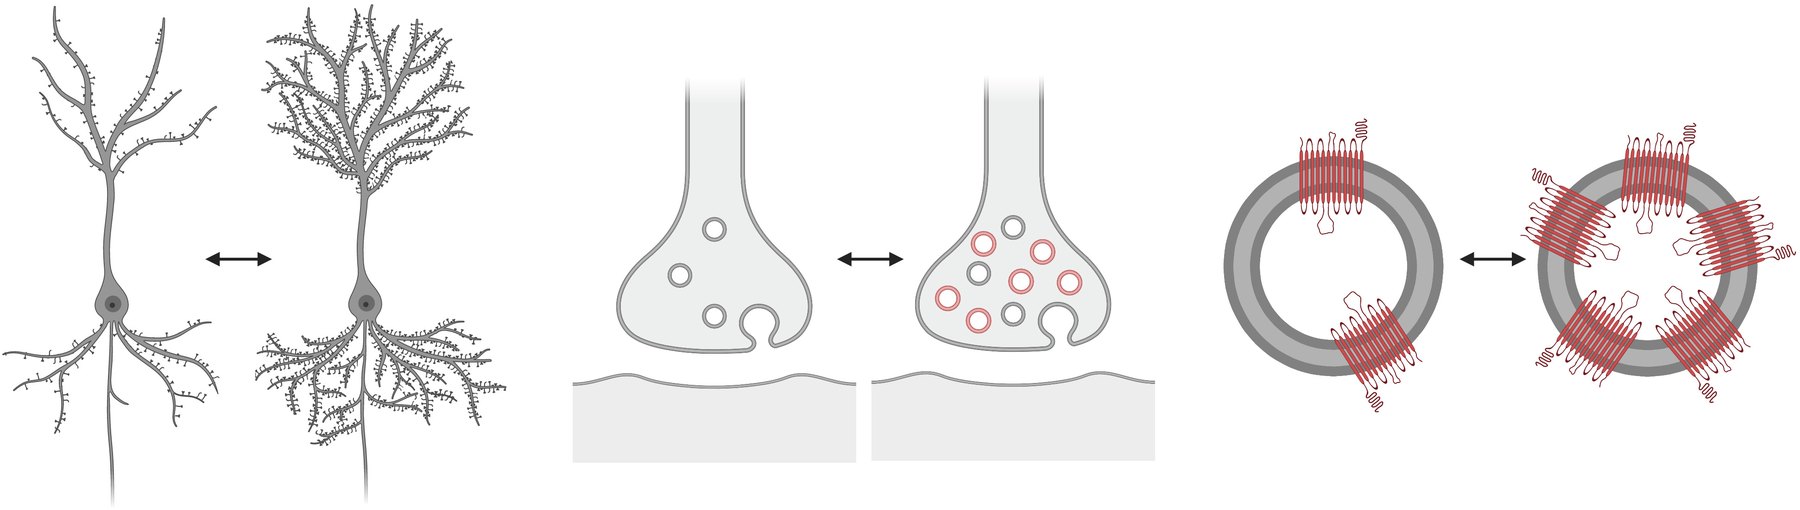
Three pairs of line drawings: a neuron with few versus many dendritic spines; a nerve terminal with few versus many synaptic vesicles; a vesicle with two versus six SV2A proteins.
What can a change in SV2A binding represent? Lower binding could reflect fewer synapses, fewer vesicles in each nerve terminal, or fewer SV2A molecules on each vesicle. PET alone cannot tell these apart. Our review of SV2A biology discusses what the tracers really detect. Rossi R, Arjmand S, Bærentzen SL, Gjedde A, Landau AM. Front Neurosci 2022;16:864514 · Figure 2 · doi:10.3389/fnins.2022.864514 · CC BY 4.0; labels added below the figure.

03 How we measure it · supporting evidence

Two views of one target, and a check that the signal is real

Read moreShow less: Two views of one target, and a check that the signal is real

We measure SV2A in the living brain with PET, and in thin brain sections with autoradiography, using the same molecule labelled with two different isotopes.

In vivo · the living brain

PET

[11C]UCB-J
  • Scans the whole brain, and can be repeated in the same animal, for example before and after a treatment.
  • Kinetic modelling turns the scan into a binding measure, the volume of distribution (VT).
  • Resolution is in millimetres, so small structures blur together.
Walk through a [11C]UCB-J scan →
Ex vivo · brain sections

Autoradiography

[3H]UCB-J
  • Maps binding on thin sections at far finer detail, read for 2 hours on our real-time BeaQuant system.
  • Specificity is checked directly, on sections incubated with a drug that blocks SV2A.
  • Each brain gives one time point.
How real-time autoradiography works →
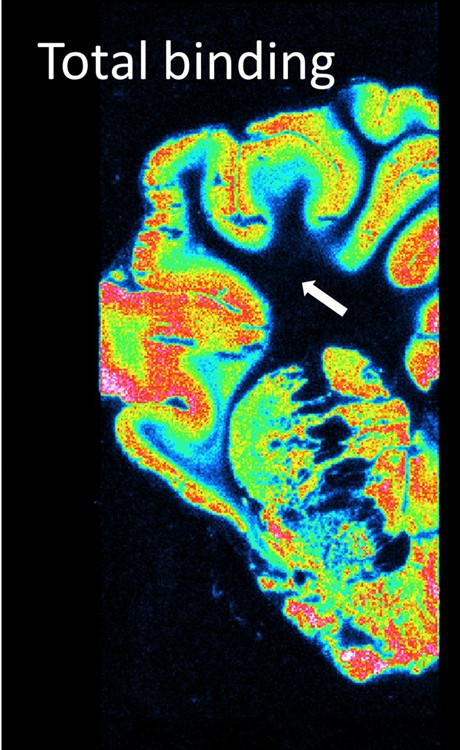
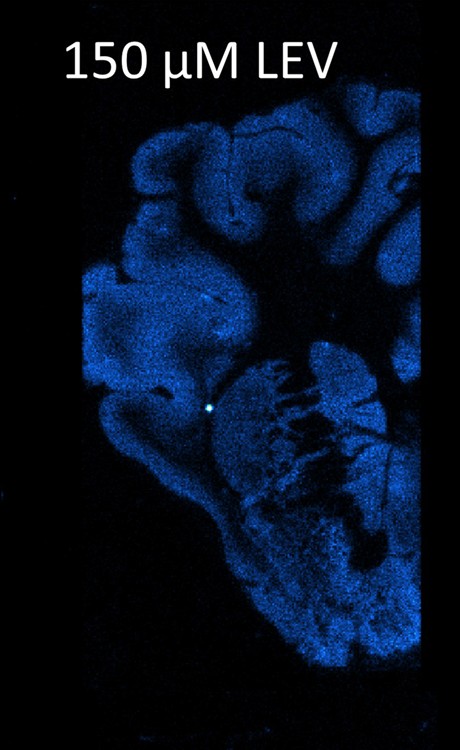
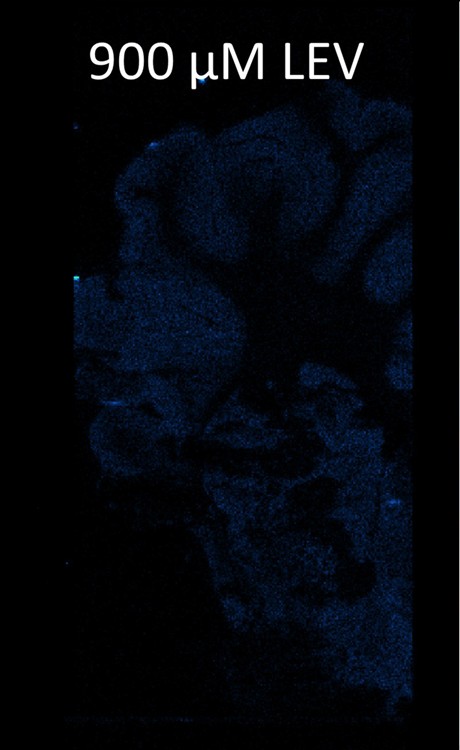
Is the signal really SV2A? · block the sites and seeDemo playing · press to take over

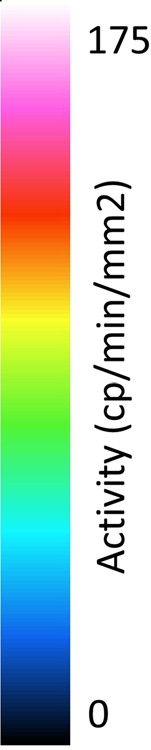
[3H]UCB-J autoradiography of Göttingen minipig brain hemisections at the level of the striatum: total binding, and binding with 150 µM or 900 µM levetiracetam added. Arrow: centrum semiovale white matter. Colour scale 0–175 cp/min/mm²; sections read for 2 h on the BeaQuant. Thomsen MB, Schacht AC, Alstrup AKO, … Brooks DJ, Landau AM. Preclinical PET studies of [11C]UCB-J binding in minipig brain. Mol Imaging Biol 2020;22(5):1290–1300 · Figure 4a, top row · doi:10.1007/s11307-020-01506-8 · First published in Molecular Imaging and Biology, 22, 1290–1300, 2020 by Springer Nature · © 2020 World Molecular Imaging Society · reused by the authors; cropped (columns shown one at a time) and resized only; not CC-licensed.

Published figure, two panels. A: rat brain images in three views. Top row, MRI template. Middle row, [11C]UCB-J PET at baseline, bright across the brain. Bottom row, the same rat after levetiracetam, almost uniformly dark. B: time–activity curves over 90 minutes for six brain regions; after levetiracetam the curves peak within minutes and fall quickly.
The same check in the living brain. One healthy rat scanned twice: at baseline, and after 100 mg/kg levetiracetam. With SV2A occupied, the [11C]UCB-J image all but disappears; across the study, levetiracetam blocked up to about 80% of the binding. Figure 1. (A) Rat MRI template (top) and [11C]UCB-J PET in one rat at baseline (middle) and after 100 mg/kg levetiracetam (bottom): standardised uptake value (SUV) images, 30–90 min, scale 0–6 g/mL. (B) SUV time–activity curves in six regions, at baseline (left) and after levetiracetam (right). Thomsen MB et al., J Cereb Blood Flow Metab 2021;41(4):819–830 · doi:10.1177/0271678X20931140 · from the authors' submitted manuscript; © The Author(s) 2020, published by SAGE. Not under a Creative Commons licence; reproduced unmodified.

When the two methods agree

LOSS OF SV2A BINDING, LESIONED VS INTACT SIDE 20 µg QA 39.3% 38.4% 40 µg QA 55.1% 52.5% PET (VT) Autoradiography

In rats with a one-sided striatal lesion made with quinolinic acid (QA) at two doses, [11C]UCB-J PET and [3H]UCB-J autoradiography found closely matching losses of SV2A binding on the lesioned side.

Thomsen et al., J Cereb Blood Flow Metab 2021 · doi:10.1177/0271678X20931140 · Table 2, redrawn.

Agreement has to be checked

In minipigs, autoradiography and PET values correlated overall, but the correlation depended mainly on the contrast between white and grey matter (r² = 0.72 overall; 0.03 without white matter). Agreement between methods has to be tested region by region.

04 Where next

Papers in this theme

  1. 2024
    Bærentzen SL, Waszkiewicz AL, Thomsen M, Knudsen C, Elfving B, Landau AM · Neuroscience Applied
  2. 2021
    Binda KH, Lillethorup TP, Real CC, … Chacur M, Landau AM · Experimental Neurology
  3. 2025
  4. 2021
    Thomsen MB, Jacobsen J, Lillethorup TP, … Brooks DJ, Landau AM · Journal of Cerebral Blood Flow & Metabolism

    Sets up [11C]UCB-J PET in the rat, with blocking and lesion models checked against autoradiography.

  5. 2020
    Thomsen MB, Schacht AC, Alstrup AKO, … Brooks DJ, Landau AM · Molecular Imaging and Biology

    The same tracer in the larger, folded minipig brain, compared with autoradiography and SV2A protein levels.

  6. 2022
    Rossi R, Arjmand S, Bærentzen SL, Gjedde A, Landau AM · Frontiers in Neuroscience

    What is known, and not known, about SV2A, and what that means for reading SV2A images.

All synaptic imaging papers →What can a PET scan tell us? →

Questions for review

  1. Is "a proxy for synaptic density, not a count of synapses" the framing you want for the page?
  2. Are these the right findings to feature, and is "lower / higher SV2A binding" the right wording for each?
  3. Should the "no change" results (α-synuclein overexpression, Alzheimer's tissue, chronic mild stress) stay on the page?
  4. The minipig paper gives the autoradiography block as 89.1% and 97.0% in the Results, but in the opposite order in the Discussion, so the page avoids quoting a number. Which is correct?
  5. Is there a team photo or a [11C]UCB-J image you would prefer as the hero?